Open-Jev: 7.47× faster inference on H200
System1-Omni's native Rust/CUDA backend runs Open-Jev-27B-v1.1 at 48.50 ms mean warm HTTP latency, versus 362.21 ms with raw HF Transformers. That is 7.47× faster, saving 313.71 ms per request.
One H200 · BF16 · concurrency 1 · 74 real JevBench noul requests/pass ·
one candidate/request · 80–3,399 tokens · two measured passes per arm.
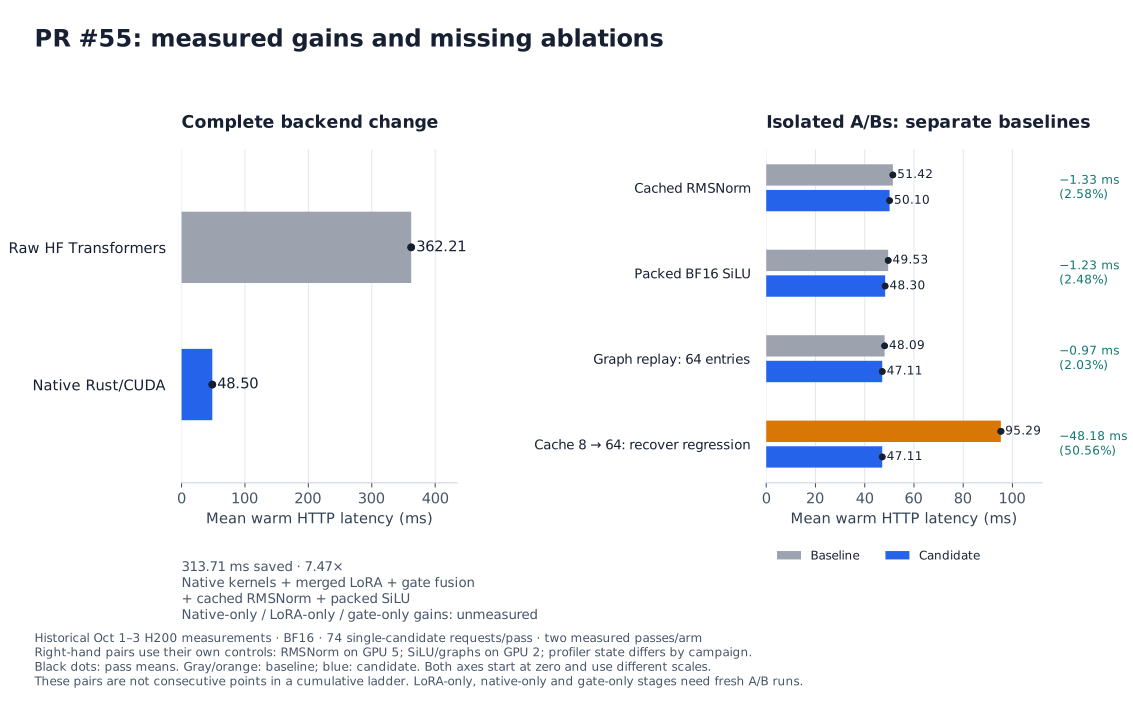
Complete backend change on the left; isolated tuning pairs on the right. Each pair has its own baseline: these gains cannot be added. Dots are two pass means.
The same-H200 comparison — PR #55, October 3
| Backend | Mean HTTP (ms) | Pass 1 / pass 2 (ms) | Correct / 74 |
|---|---|---|---|
| Raw HF Transformers | 362.209 | 362.238 / 362.180 | 64 |
| Native Rust/CUDA, eager | 48.503 | 48.471 / 48.535 | 64 |
| OpenJev-Fast | 50.936 | 51.097 / 50.775 | 63 |
Native's mean is 4.78% below Fast; Fast has the lower median. HF/native match all 74 decisions, with maximum probability difference 0.020423. Fast differs on one decision. These are subset results. Three-backend figure.
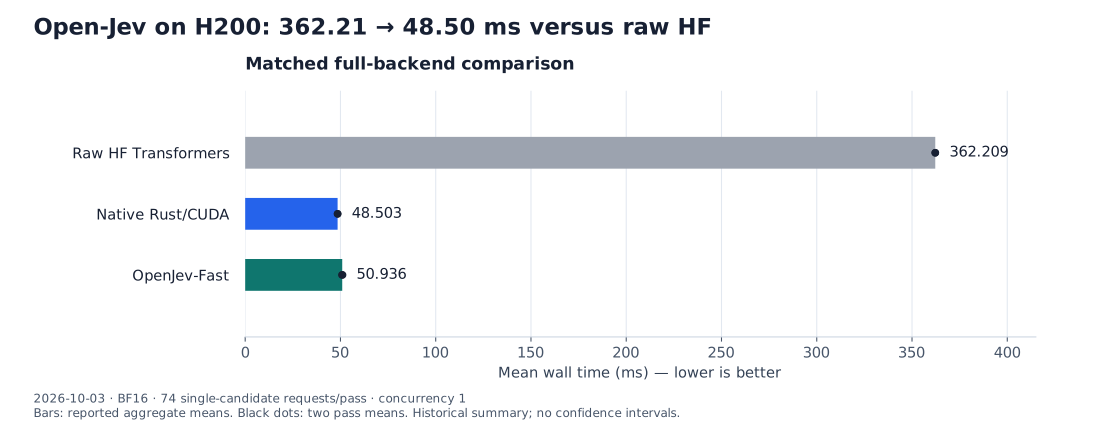
Raw HF uses unmerged PEFT LoRA, stock SDPA and PyTorch linear-attention/conv fallbacks; optional FLA/causal-conv dispatch is disabled. Native uses merged weights and custom CUDA kernels; Fast uses its own kernel/graph stack. Frozen setup.
What PR #55 changes
| Optimization | How it removes work |
|---|---|
| Native prefill | Shared CUDA GDN/attention kernels and grouped projection GEMMs |
| LoRA merging | Compute adapter updates once at export; remove runtime low-rank projections |
| Attention-gate fusion | Sigmoid/multiply in the attention epilogue; remove a launch and intermediate write/read |
| Cached RMSNorm | Keep residuals in registers across reduction; avoid rereading them |
| Packed SiLU | Load/store eight BF16 values at a time; preserve expf and rounding |
| CUDA Graph replay | Submit a captured forward with one graph launch |
Native-only, LoRA-only and gate-only timings remain unmeasured. RMSNorm and SiLU each pass their ≥2% HTTP / ≥25% kernel-family gates; all 74 native probabilities/decisions stay unchanged. Kernel A/B figure.
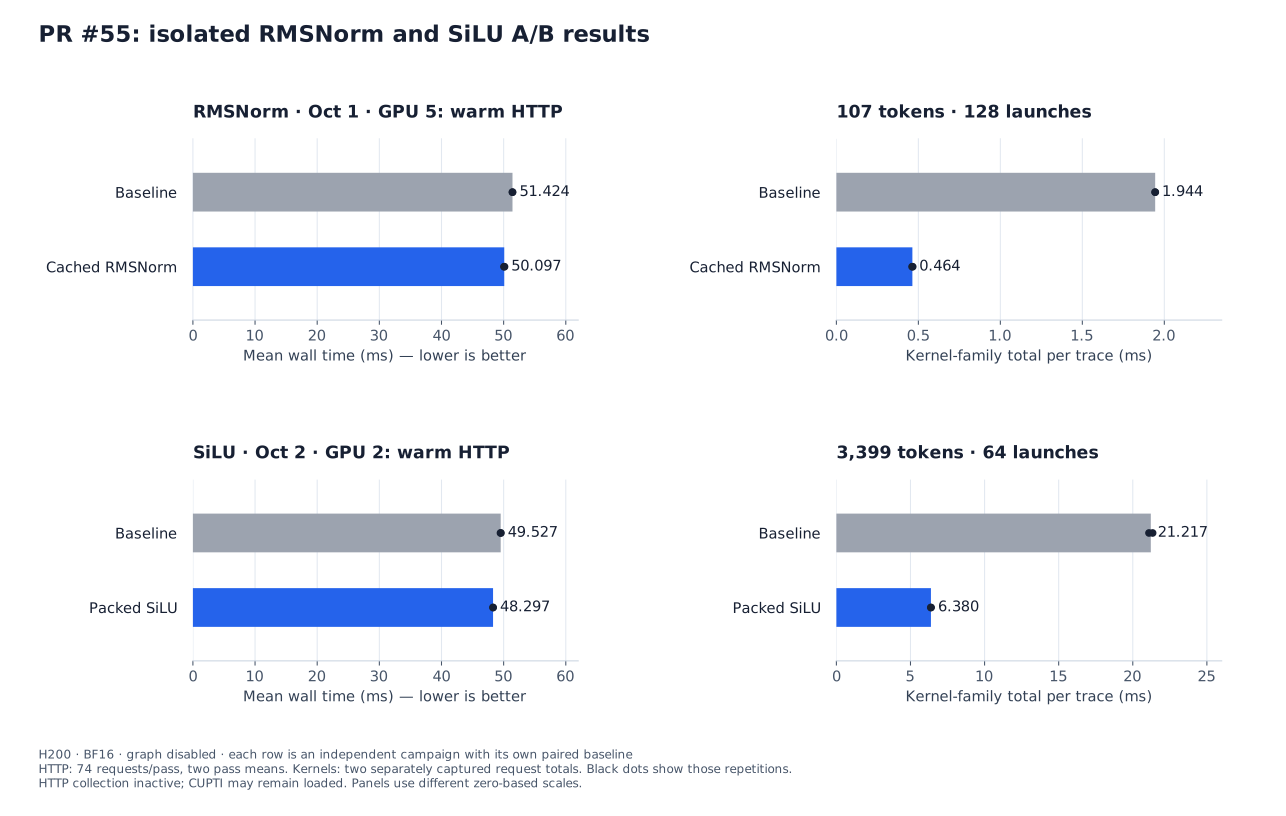
Code: PR #55, RMSNorm/SiLU, LoRA export, attention gate. The executor and graph ancestry are #19 and #52.
CUDA Graphs: fit the cache to the workload
57 token lengths → 64 cache entries. Eight entries repeatedly evict and recapture graphs. Warm replay reduces host submission; the short trace still executes the same 834 GPU kernels, through one graph launch.
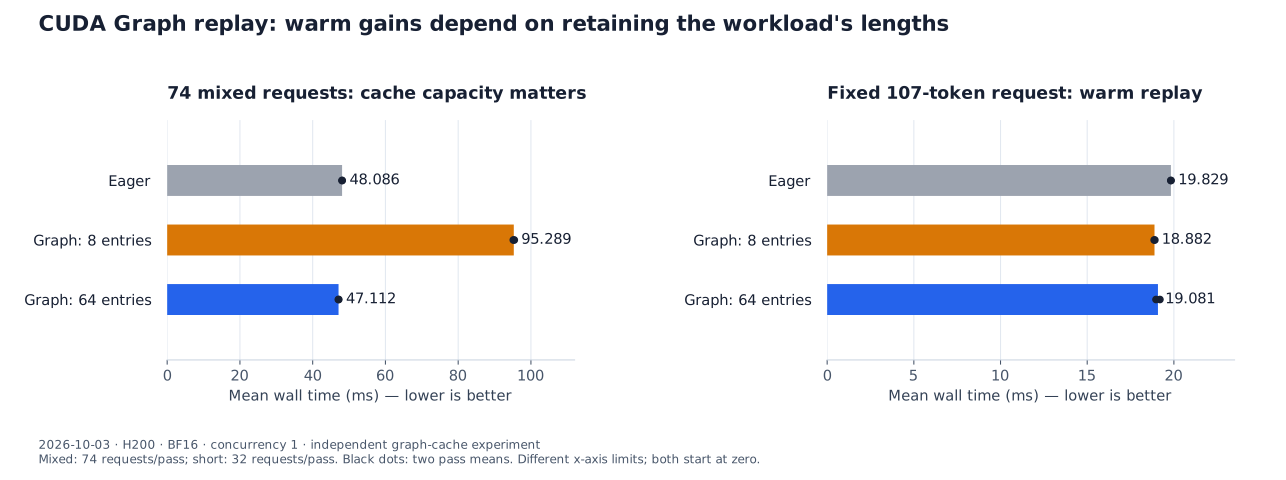
Graph-64 saves 2.03% mixed / 3.77% short versus matched eager controls. The eight-entry mixed regression stays visible. Dots: two pass means.
Graph mode is opt-in (CUA_S1_GRAPH=1). New lengths pay capture cost;
tokenization, transfers and CPU scoring stay outside capture.
All 74 native outputs match. Capacity change
and protocol/traces.
Gated DeltaNet preparation — PR #68, October 3
Pack TF32 Q/K once and write U/W directly as BF16. Shared memory drops from 92 → 72 KiB, preserving four-term accumulation and rounding.
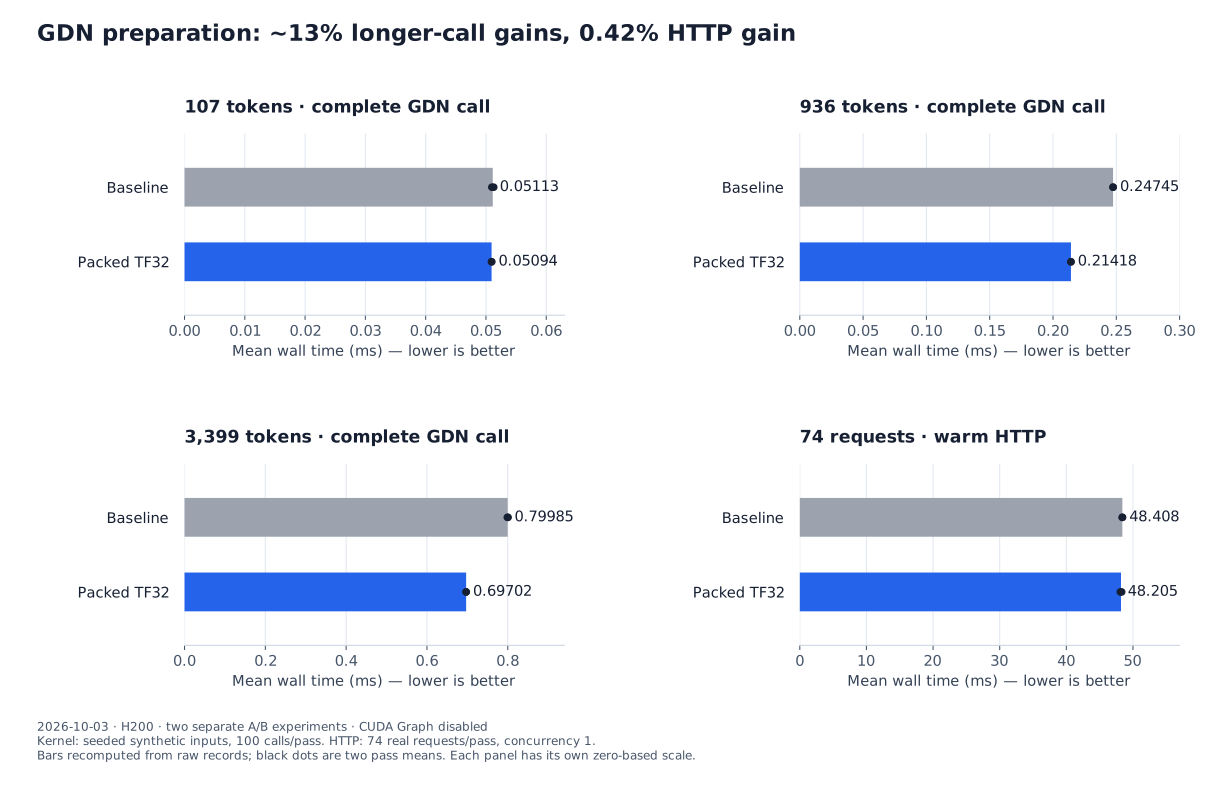
About 13% faster at 936/3,399 tokens, but only 0.42% HTTP improvement. The ≥10% longer-call gate passes; the ≥2% HTTP gate is missed. Graphs disabled.
All 74 native outputs match. BF16/FP16 alternatives failed numerical checks; eight-term TF32 changed intermediate bits. October 4 integration passed six GPU tests without a new latency measurement. PR #68 · raw runs, rejected variants and integration.
Processing and runtime — PRs #78 / #80, October 5
#78 separates prepare/execute/finish; #80 adds FIFO admission before blocking dispatch. Both pass regression gates; neither establishes a speedup.
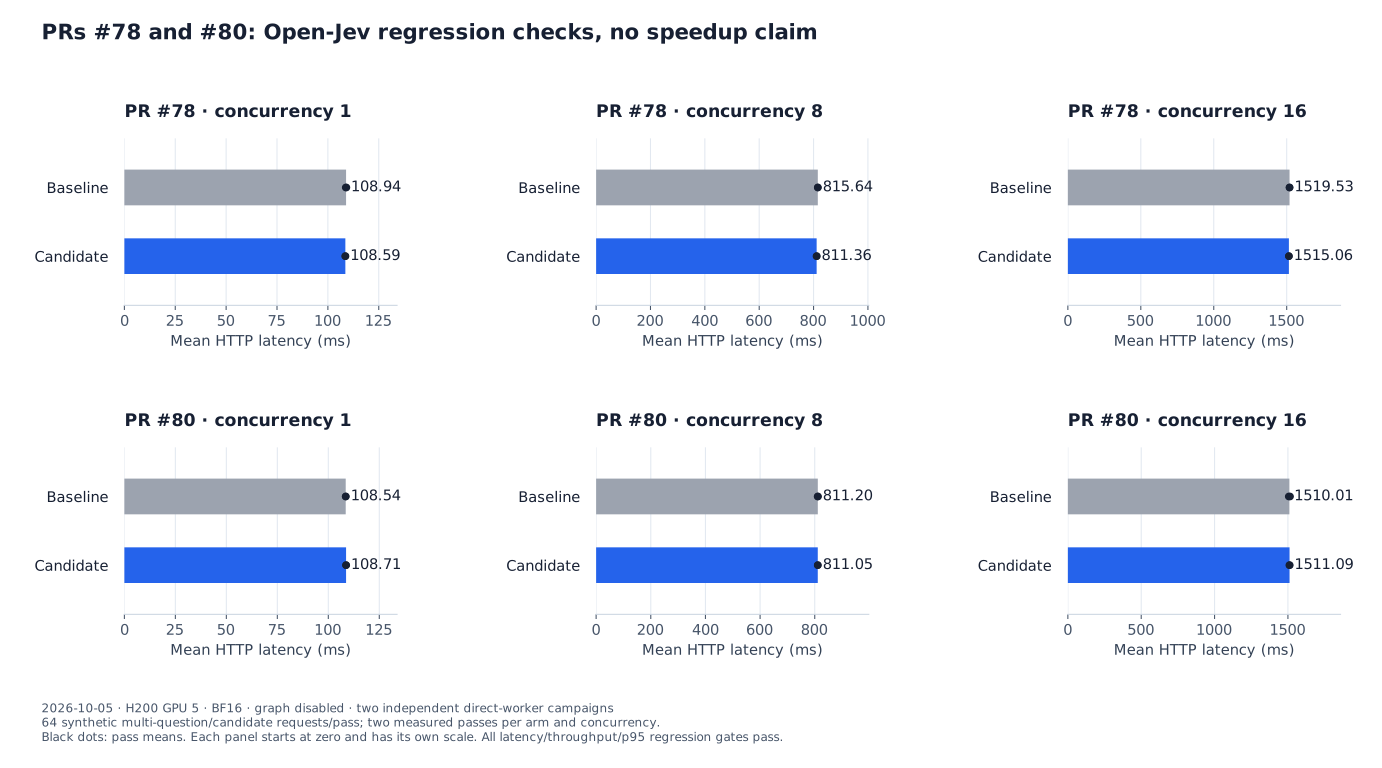
Synthetic multi-question/candidate requests, direct-worker HTTP; separate from the JevBench frontend timer. Two 64-request passes per arm/model/concurrency.
Each campaign: 1,536 requests across Open-Jev/Cua-S1 · zero failures · responses match except elapsed-time metadata · mean/p95/throughput gates pass. GPU batching remains planned.
Setup, evidence and next measurements
The JevBench timer includes localhost HTTP, tokenization, worker execution and response-body decoding. Preparation, readiness, first inference and warmups are excluded; graph runs warm maximum scratch before measurement.
Next: a matched raw HF → merged-LoRA HF → native scalar/unfused → fused gate → cached RMSNorm → packed SiLU → Graph-64 ladder. Intermediate stages and merged GDN + Graph remain unmeasured; prefix sharing needs its own comparison.
Evidence ledger: frozen
revisions, device UUIDs/affinity, controls, per-run values and gates.
Timing export:
78 measured passes / 5,040 timings with provenance/parity hashes.
Full response/protocol/trace archives remain local. These October 1–5 results
are historical measurements, inspected against f594d7d; current main is untimed.
Regenerate figures without GPU use:
python docs/assets/blog/open-jev-20261005/plot.py
mkdocs build --strict
Inference setup. Presentation references: OpenJev-Fast, Qwen3-Omni, Kimi K3.